
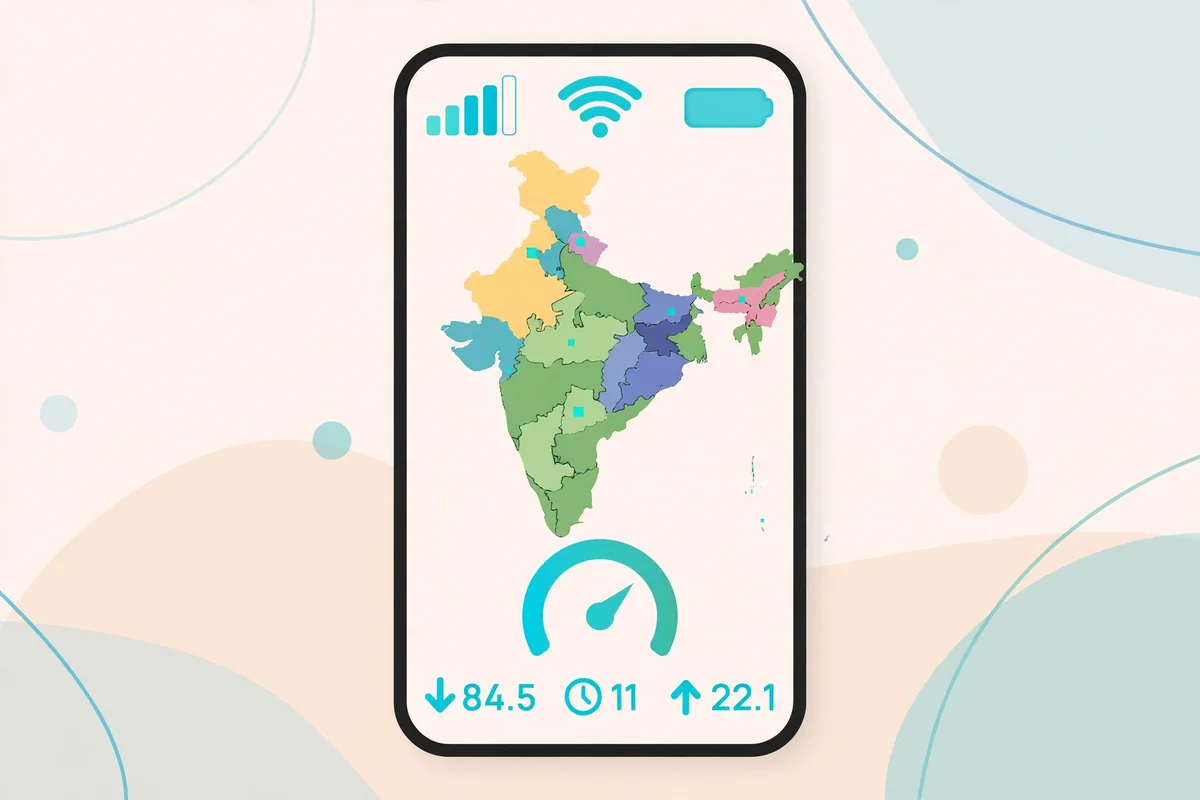

The Telecom Regulatory Authority of India (TRAI) has launched Network Anubhav — a map-based platform that shows the network speeds people actually recorded in your area, for Jio, Airtel, Vi and BSNL. Launched on 4 November 2026, it is the first TRAI tool that lets anyone compare operators area by area before switching a SIM or picking a broadband plan.
📑 On This Page
Anubhav means “experience” — and that is the point: the map shows real user experience, not the coverage claims on operator websites.
Quick Facts
- What: TRAI Network Anubhav Platform — a geospatial analytics dashboard for mobile and broadband performance
- Launched: 4 November 2026
- Operators covered: Jio, Airtel, Vodafone Idea (Vi), BSNL (with MTNL)
- Portal: anubhav.trai.gov.in
- Data sources: TRAI MySpeed app, MyCall app, and TRAI’s Independent Drive Tests
- Cost: free to use
What Network Anubhav Shows You
Open the portal, search for your area, and the map fills with coloured patches — each one an area where people ran speed tests. You can switch between mobile and home broadband, pick an operator (Airtel, Jio, Vi, or BSNL and MTNL together), pick a technology (5G, 4G, 3G or 2G), and colour the map by download or upload speed. For 5G downloads, the legend sorts each patch into four bands: under 20 Mbps, 20 to 50 Mbps, 50 to 100 Mbps, and 100 Mbps or more.
You can zoom into individual areas, see the distribution of tests there, and download reports for further analysis. A separate tab shows the drive tests TRAI’s agencies run — test phones carrying all four operators’ SIMs driven along set routes.
How to Read the Speed Numbers: P50, P80 and P90
TRAI reports three statistical indicators so you can judge what the numbers actually mean:
- P50 (Median Speed): half the tests in that area got this speed or better — the typical experience.
- P80 (Mobile Broadband): the speed that 80% of mobile tests reached or beat — the slower end of what people there got.
- P90 (Fixed Broadband): the speed that 90% of fixed broadband tests reached or beat.
A big gap between P50 and P80 in one area means speeds there varied a lot — some users got fast speeds, others much slower.
Where the Data Comes From
The speed tests come from TRAI’s own MySpeed app (Android, iPhone and web), which measures download and upload speed. A second app, MyCall (Android only), lets you rate each call from 1 to 5 — those ratings have their own tab on the platform. TRAI has also introduced a MySpeed SDK so eligible third-party apps can add their own speed measurements to the map.
TRAI has encouraged consumers to contribute regularly through MySpeed and MyCall, so the map’s coverage keeps improving.
DND Spam Complaints from the Same Portal
The same portal also opens TRAI’s Do Not Disturb (DND) service in a web browser. You can set which promotional calls and texts you are willing to get, report a spam call or SMS, track your complaint, and see complaint figures for each operator.
The Honest Catch — What the Map Does NOT Promise
This is the part to read carefully. TRAI says so itself: the results “do not represent comprehensive assessment of network quality based on standard methodology”, and the dashboard repeats the warning at the top of the page. The tests come from people who chose to install the app and press the button — indoors or out, on a new phone or an old one, at midnight or at peak hour. On the night of 4 November, the 5G download map of central Nagpur showed scattered patches with empty streets between them, and next-door patches in different bands. A blank street means the map shows no results there — it says nothing either way about the signal.
TRAI’s release also leaves out two things a reader would want: over what period the tests on the map were collected, and how many tests an area needs before it appears. And TRAI says it “does not provide direct consumer services” — a dropped call or slow line still goes to your operator’s complaint process, not to TRAI through this portal.
Why This Matters for You
Before this, comparing networks meant trusting operator coverage maps or asking neighbours. Network Anubhav gives you the next best thing: real test results from your own area, split by operator and technology, with the typical speed and the slower end both visible. It will not settle every “which SIM is best” argument — the data is user-generated, not a lab test — but for a SIM switch or a broadband decision, it is now the first place to check.
Our take: a genuinely useful transparency tool, as long as you read it the way TRAI asks you to — as a map of real user tests, not a promise of the speed you will get.
Related reading: Jio Voice Only Plans Price List in India • TRAI New Telecom Complaint Rules 2026 • Jio Rs 15 Unlimited 5G Pack Launched in India
Have you checked your area on Network Anubhav yet — and does the map match the speed you actually get? Tell us in the comments.